DMO paid media ROI: proving economic impact to your board
72% of DMOs name ROI metrics as key proof for stakeholders, so this guide ranks six kinds of evidence by cost and adds a one-page board summary.
Russell Goodall, Founder Published 11 min read
The short answer
Boards accept the outcomes their funders already count, such as partner referrals, room nights and visitor spending, not impressions. In Sojern's February 2026 survey of 350+ DMOs, 72% named conversion and ROI metrics among the most important proof for stakeholders (Sojern, 17 Feb 2026). The same share, 72%, named economic impact data.
Each number needs a target and a stated method. The shortest honest route has three steps. Count partner referrals live from the first day of every campaign. Set them beside the hotel data you already buy. Commission a lift study or an ROI model only for campaigns big enough to pay for one.
Board expectations: reach no longer counts as proof
The shift was fast. In the same Sojern survey, the share of DMOs focused on awareness fell from 59% in 2025 to 25% in 2026. In North America, 79% now put hotel room nights and direct revenue ahead of brand awareness. In Europe, 31% say their funding is at risk (Sojern, 17 Feb 2026).
Public auditors push the same way. In 2022, Louisiana's legislative auditor reviewed the state tourism office. It said the office could judge specific campaigns better "by engaging an independent vendor to evaluate their effectiveness" (Louisiana Legislative Auditor, Dec 2022). The question is no longer "did people see it?" It is "what did it bring, and who checked?"
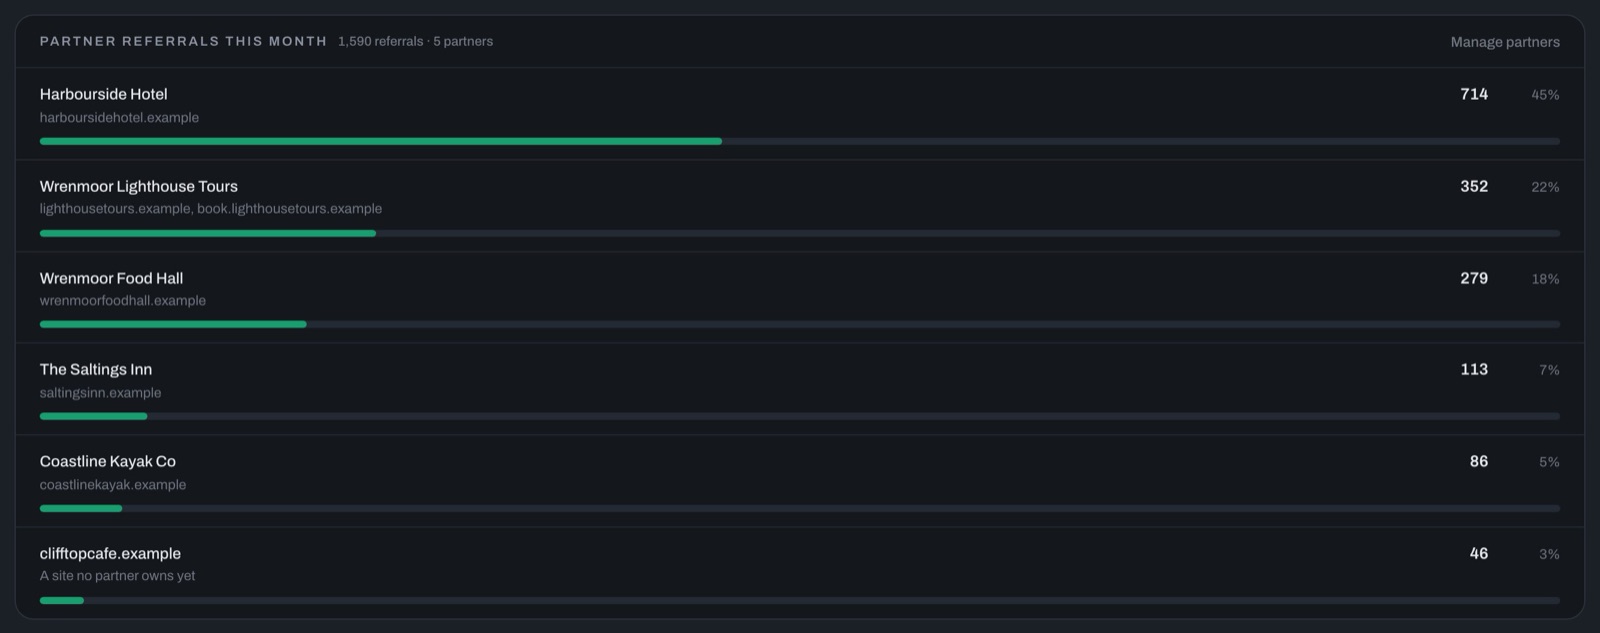
Put referrals by partner on the first page of the board report. It answers the board's real question, what did it bring and to whom, in the board's own terms.
The proof ladder: six rungs, from weakest to strongest
We use this ladder to sort every number a tourist board might show its board. Each rung costs more than the one below it and proves more. No single rung settles the question, so a strong report says which rung each number stands on.
| Rung | What it proves | What it can't prove | Cost |
|---|---|---|---|
| 1. Impressions and clicks | The ads ran and people responded | That anyone traveled | Free in every ad report |
| 2. Partner referrals | Travelers moved on to the businesses that fund you | That they booked | Low: link tracking |
| 3. Visitation lift from location data | People who saw the ads turned up more often | What they spent | A paid study |
| 4. Hotel occupancy, rate or booking data | The outcome your funders feel moved | That your campaign moved it | A data subscription |
| 5. Economic impact models and ROI studies | A modeled value of spending, jobs or tax | What the model's assumptions miss | A commissioned study |
| 6. Incrementality tests | What the campaign caused, against a control | Small effects on small budgets | Held-back media, plus analysis |
Rung 1, impressions and clicks: proof the ads ran
Every ad platform reports these at no cost. They show the media was delivered and people responded. They don't show a single trip.
A click is not even a visit, because not every click loads your page. If you report clicks, put the visitors who arrived on your site beside them. Our guide to why ad clicks don't match bookings covers the gap.
Rung 2, partner referrals: the number your funders already count
A referral is a click from your website through to a partner's own site: a hotel, an attraction, an event. A 2021 Simpleview guide calls referrals "one of the very best metrics for DMOs", because they are close to a purchase (Simpleview, 24 Feb 2021).
They are cheap to count. Google Analytics 4 logs them as outbound clicks when enhanced measurement is on. It records one "each time a user clicks a link that leads away from the current domain" (Google Analytics Help, opened 23 Oct 2026).
What a referral can't prove is the booking. It shows intent, handed to a partner. The partner can still check it, because the visit shows up in its own website traffic.
Rung 3, visitation lift: did people who saw the ads turn up?
Location-data firms match phones that saw your ads with phones later seen in your destination. Arrivalist, Datafy and Zartico all sell this kind of measurement to destinations (Arrivalist, 26 May 2025; Zartico, 22 Jan 2025).
The better studies use a holdout: a group of matching devices kept from seeing the ads. In a 2024 post, Datafy describes comparing the visit rate of ad-exposed devices with that control group to estimate lift (Datafy, 31 Jan 2024).
The cost is real. In Travel Nevada's 2026/27 co-op program, one Datafy package adds digital media attribution and an incremental lift report. It is listed at $27,500 to $36,500, before the state's 50% grant (Travel Nevada co-op program, 2026/27).
Lift on its own counts a sample of devices, not every visitor, and not what they spent. Some providers add card-spending data for that. Ask any provider where its device data comes from and how consent was collected. In the US, the Federal Trade Commission settled its first case against a data broker over sensitive location data in 2024.
The order makes the broker check that its data suppliers obtained informed consent (FTC, 9 Jan 2024). In the UK, the data regulator (the ICO) says organizations using GPS location data from phones must still comply with the Data Protection Act (ICO, opened 23 Oct 2026).
Rung 4, hotel and booking data: the outcome funders feel
Occupancy and average daily rate (ADR, the average price paid per room night) are what hotel funders feel directly. Visit NC's February 2026 partner briefing is one example. It reports hotels from STR, whole-home rentals from AirDNA and vacation rentals from Key Data (Visit NC, Feb 2026).
Spend data goes a step further. A March 2024 RateGain release says Adara's destination reports track card spending by visitors exposed to a destination's digital ads (RateGain, 28 Mar 2024).
The weakness is cause. Occupancy moves with events, weather, prices and the wider economy. Show it as context beside rung 2 or 3, never as the campaign's result on its own.
Rung 5, economic impact models and ROI studies: the number boards quote
These turn estimated extra visitors into spending, jobs and tax through an economic model. Oxford Economics and its subsidiary Tourism Economics produce Brand USA's study. For fiscal 2024 it credited Brand USA with 1,611,223 visits and an ROI of $23.37 per dollar invested (Brand USA ROI study, Mar 2025).
In the UK, destinations such as Lincolnshire use STEAM, a model from Global Tourism Solutions. It estimates visitor numbers, visitor days and economic impact (Lincolnshire STEAM report 2013–2024, Jul 2025).
Read the definition before you quote the number. "ROI" means different things in different studies:
- Visitor spending per dollar: Brand USA's $23.37 for fiscal 2024.
- Spending and tax, side by side: Visit NC's 2024 study reported an ROI of $144 in ad-influenced visitor spending. It also reported $13 in state and local tax for every $1 invested (Visit NC, Feb 2026).
- State tax only: Florida's legislative economists count state tax revenue alone. Their March 2024 report found Florida got back 58 cents in tax per dollar spent on VISIT FLORIDA's marketing in fiscal 2019–22. The figure for 2016–19 was $3.27, and Covid was the largest reason for the fall (Florida EDR, Mar 2024).
A board that hears "$144" from one state and "58 cents" from another is hearing answers to two different questions.
Models also rest on assumptions. Florida's report notes that conversion studies are "the primary tool used by state DMOs". It cites research that they "fail to answer the fundamental question" of whether the advertising was the deciding factor. We found no published price list for these studies, so ask two firms to quote.
Rung 6, incrementality tests: the closest you get to cause
An incrementality test compares people or places that saw the campaign with similar ones that didn't. A holdout test keeps a group of people from seeing the ads. A matched-market test runs ads in some cities or regions and holds back similar ones.
Brand USA's study checked its model this way. Arrivalist compared arrivals from devices that saw Brand USA ads with a control group that saw other ads (Brand USA ROI study, Mar 2025).
Free tools exist. GeoLift, an open-source package from Meta Open Source for geographic tests, starts every test with a power analysis. That analysis sets the number of test markets and the test length. It also estimates the budget needed and the smallest lift the test can detect (GeoLift documentation, opened 23 Oct 2026).
The catch is size. If the lift you can afford to create is smaller than the test can detect, the answer will be "no clear difference", whatever really happened.
Co-op campaigns: one report per partner, no chasing
Co-op is where proof gets hard. 80% of DMOs run co-op campaigns, and 27% say managing partners is too difficult for lean teams (Sojern, 17 Feb 2026).
State programs add paperwork. Louisiana's cooperative marketing grant funded 33 grants worth $526,468 in fiscal 2021 (Louisiana Legislative Auditor, Dec 2022). In Travel Nevada's program, the vendor bills the DMO in full and the state then reimburses the approved grant share (Travel Nevada, 2026/27).
Our five habits cut the admin:
- Agree one number per partner before launch. Usually that is referrals to its own website.
- Count it at your end. Tag partner links so each referral is counted as it leaves your site. No partner has to send you figures.
- Give each partner its own report. It shows only that partner's referrals and campaigns.
- Keep one calendar. Partners hear monthly, the board quarterly, with the same definitions in both.
- File proof of what ran as you go. Keep dates, placements and invoices ready for any matching-funds claim.
Stop chasing partners for their own booking figures. They arrive late, in different formats, and from the partners least able to send them. Count the referrals you send each partner instead: you can measure those yourself, every month.
UK and US: the funder decides the calendar
| UK | US | |
|---|---|---|
| Budget year | April to March for public bodies | Varies; Montana's DMOs run July 1 to June 30 |
| Funding, for example | Council funding and national funds | Lodging taxes and tourism district assessments |
| Hotel-funded marketing | Accommodation BIDs | Tourism improvement districts (TIDs) |
| Who may read the summary | Council, partnership board, partners | City or county board, TID board, partners |
UK. Public bodies budget April to March. Plymouth's 2023 plan for a county destination body assumed council seed funding from "April 2024 through to March 2027" (Destination Plymouth, 6 Oct 2023).
VisitEngland lists 38 Local Visitor Economy Partnerships (LVEPs, its accredited local destination bodies) (VisitBritain, opened 23 Oct 2026). Lead LVEPs can bid for the £3.38m Connected Destinations Fund. About £800,000 is available in 2026/27, in grants of up to £200,000 (VisitBritain, Sept 2026).
New hotel levies are arriving. Manchester's accommodation BID was set to start on 1 April 2023 for five years. Hotels and serviced apartments in its zone pay the BID levy (Manchester City Council, Sept 2022). Guests pay a £1 City Visitor Charge per room per night, added to their bill, and it has been in place since April 2023.
The charge funds work that includes "amplifying marketing campaigns that drive overnight stays" (Manchester Accommodation BID, opened 23 Oct 2026). Edinburgh's visitor levy of 5% applies to overnight stays from 24 July 2026, for up to five nights in a row (City of Edinburgh Council, 24 Jan 2025). After running costs and fixed sums, 10% of the rest goes to destination and visitor management (City of Edinburgh Council, 24 Jan 2025).
In England, the government published its consultation response on 10 September 2026. It says all mayoral and foundation strategic authorities will get the power to set an overnight visitor levy. The levy will be a percentage of the accommodation cost, and accommodation providers will be liable for it.
The law still has to go through Parliament. If Parliament approves it, the government expects local leaders to be able to set out spending plans by March 2028 (MHCLG and HM Treasury, 10 Sept 2026). When hoteliers pay a levy, they ask what it bought, so lead with room nights and referrals to their sites.
US. Montana's DMOs budget from projected state lodging facility taxes, for a July 1 to June 30 year. Leftover funds are "typically available by September 1" (Montana Department of Commerce, Mar 2025).
Tourism improvement districts are the other route: hotels in a district pay an assessment that funds marketing. Napa Valley's TID charges 2% of short-term room revenue, about $11m a year. Local committees report quarterly and at year end, and an annual report goes to the county Board of Supervisors (Napa Valley TID plan 2025–2035, 5 Jun 2024).
Send your strongest summary before the budget is set: before April in the UK, and before your own fiscal year starts in the US.
The one-page board summary (our template)
Use the same page every month or quarter, in this order:
- The headline number against target. The one outcome your funders pay for, usually partner referrals or room nights, against target and the same period last year.
- Spend and delivery. What you spent, the clicks, and the visitors who arrived.
- Partner results. Referrals by partner or partner type, with co-op partners marked.
- Where visitors came from. Origin markets against the markets you planned.
- Context. Occupancy and ADR against last year, labeled as context, not as the campaign's result.
- Stronger evidence, if you have it. A lift study or ROI figure, with its definition and who produced it.
- What changed and what's next. What you cut, what you moved, and any decision you need from the board.
- Method. Sources, date range, and which rung of the ladder each number stands on.
Limits: what no report can do
- Attribution in tourism is never complete. Many trips start without an ad. In Florida's visitor research for fiscal 2018–22, an average of 73% of respondents said a previous trip influenced their decision (Florida EDR, Mar 2024). For you, that means reporting the rung, never a bare "ROI".
- Small budgets can't fund lift studies. A lift study needs enough exposed people to beat chance, which is what a power analysis checks. The Nevada co-op package with a lift report starts at $27,500. On a small budget, report rungs 2 and 4 well and say plainly why you stop there.
- One period can mislead. Florida's ROI fell from $3.27 to 58 cents per dollar across a period hit by Covid. Its economists still use a working ROI of 3.3 for forward-looking analysis (Florida EDR, Mar 2024). Show several periods, not one.
Where Itinex fits
Itinex is a travel advertising platform built on one of the world's largest native advertising networks. For a tourist board, it covers rungs 1 and 2, with clicks reported beside the visitors who arrived:
- Every partner referral is counted in a live report the board can open.
- Each partner gets its own report link: its referrals and the co-op campaigns it is on, never another partner's.
- The board gets a one-page summary for any month or quarter.
Lift studies and economic impact models are work for a research firm. Every starting price is on the pricing page.
Next step: See the partner report and board summary in the demo. The demo asks for your name and company email. Its tourist board account is a made-up destination with sample numbers.
Sources
- Sojern's 2026 State of Destination Marketing Report (press release) — Sojern, 17 Feb 2026 Checked 23 Oct 2026.
- Louisiana Office of Tourism, Report Highlights, Audit Control #40210027 — Louisiana Legislative Auditor, Dec 2022 Checked 23 Oct 2026.
- Data Sources for Assessing Local Travel Recovery in the Desire Stage — Simpleview, 24 Feb 2021 Checked 23 Oct 2026.
- [GA4] Enhanced measurement events — Google Analytics Help, undated Checked 23 Oct 2026.
- Arrivalist, "Reborn" — Arrivalist, 26 May 2025 Checked 23 Oct 2026.
- Zartico Launches Marketing Performance Solutions — Zartico, 22 Jan 2025 Checked 23 Oct 2026.
- 5 reasons DMOs need their data and advertising programs linked — Datafy, 31 Jan 2024 Checked 23 Oct 2026.
- Travel Nevada Co-op Program 2026/2027 (Datafy) — Travel Nevada, 2026 Checked 23 Oct 2026.
- FTC Order Prohibits Data Broker X-Mode Social and Outlogic from Selling Sensitive Location Data — Federal Trade Commission, 9 Jan 2024 (order finalized 11 Apr 2024) Checked 23 Oct 2026.
- Location data (Guide to PECR) — Information Commissioner's Office, undated (marked as under review after the Data (Use and Access) Act) Checked 23 Oct 2026.
- Visit NC 101 Partner Webinar Deck — Visit NC, Feb 2026 Checked 23 Oct 2026.
- RateGain's Adara to Offer Enhanced Destination Campaign Measurement with Advanced Visitor Spending Data — RateGain, 28 Mar 2024 Checked 23 Oct 2026.
- The Return on Investment of Brand USA Marketing, Fiscal Year 2024 — Oxford Economics / Tourism Economics, Mar 2025 (hosted by U.S. Travel Association) Checked 23 Oct 2026.
- Return on Investment for VISIT FLORIDA — Florida Office of Economic and Demographic Research, Mar 2024 Checked 23 Oct 2026.
- STEAM Report for 2013–2024, Lincolnshire — Global Tourism Solutions (UK) Ltd for Visit Lincolnshire, Jul 2025 Checked 23 Oct 2026.
- GeoLift Walkthrough — Meta Open Source, undated (site copyright 2025) Checked 23 Oct 2026.
- DMO Review and development of Local Visitor Economy Partnership for Devon — Destination Plymouth board paper, 6 Oct 2023 Checked 23 Oct 2026.
- Local Visitor Economy Partnership (LVEP) Programme — VisitBritain, undated Checked 23 Oct 2026.
- Connected Destinations Fund — VisitBritain, Sept 2026 Checked 23 Oct 2026.
- Manchester Accommodation Business Improvement District (ABID), Executive report — Manchester City Council, Sept 2022 (Executive meeting 14 Sept 2022) Checked 23 Oct 2026.
- Manchester Accommodation BID (City Visitor Charge) — Manchester Accommodation Business Improvement District Ltd, undated (© 2026) Checked 23 Oct 2026.
- Scheme for the Edinburgh Visitor Levy: scheme area, start date and duration — City of Edinburgh Council, 24 Jan 2025 Checked 23 Oct 2026.
- Scheme for the Edinburgh Visitor Levy: use of net proceeds — City of Edinburgh Council, 24 Jan 2025 Checked 23 Oct 2026.
- Visitor levy in England (consultation outcome and government response) — MHCLG and HM Treasury, 26 Nov 2025, response added 10 Sept 2026 Checked 23 Oct 2026.
- FY26 DMO Budgeting Sources — Montana Department of Commerce, Mar 2025 Checked 23 Oct 2026.
- Napa Valley Tourism Improvement District Management District Plan 2025–2035 — City of Napa, plan dated 5 Jun 2024 Checked 23 Oct 2026.
How we made this: written with AI from the sources above, each opened before it was cited, and read and approved by Russell Goodall. Our editorial standards